The ADX is one of the most reliable trend strength indicators ever developed — but most traders only run it on the chart they're currently looking at. If you're trading M15, you see M15 ADX. You have no idea whether the H1 or H4 trend is actually strong or just drifting sideways. You enter a trade thinking there's momentum behind it, and then wonder why it immediately stalls.
MTF ADX solves this with four inputs and zero chart switching.
Drop it on any chart, set your reference timeframe, and the full ADX — trend strength line, +DI, and -DI — from that higher timeframe appears instantly in your sub-window. The current values are printed in the header. You know in real time whether the trend you're about to trade is genuinely strong on the timeframe that matters.
✦ Higher timeframe ADX, always visible — no chart switching, no second window, no guessing
✦ All three lines displayed — ADX strength, +DI bullish pressure, -DI bearish pressure, all in one sub-window
✦ Live values in the header — current ADX, +DI, and -DI numbers update with every tick
✦ Any timeframe combination — H1 ADX on M15, D1 ADX on H4, or any combination you need
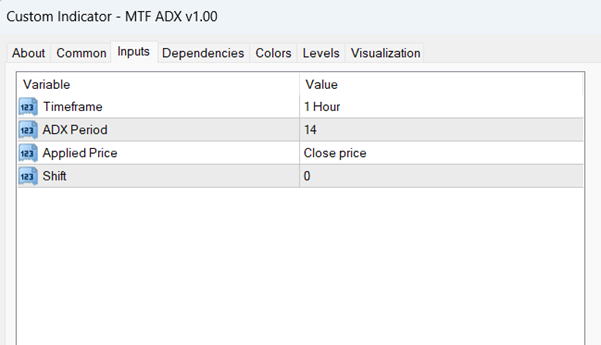
✦ Four inputs, instant setup — timeframe, period, price, shift — that's all
✦ Range filter built in by design — ADX below 25 is always visible as a warning before you enter a directional trade
Whether you use ADX as a trend filter, a directional bias tool, or a ranging market avoidance signal — MTF ADX brings the timeframe you care about directly into view on the chart you're trading.
"The trend strength that matters — from the timeframe that matters — always on screen."
How It Works
The indicator calculates the full ADX system on the selected reference timeframe (default: 1 Hour) using a configurable period and applied price, then plots all three lines continuously in a dedicated sub-window below the main price chart:
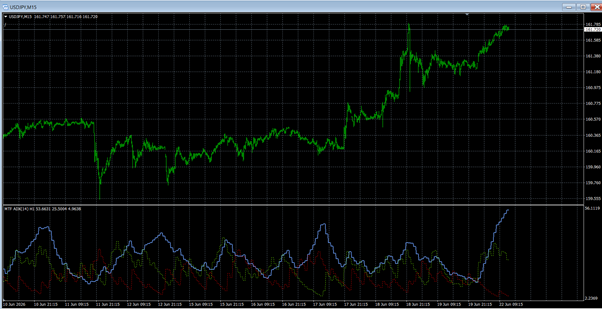
- 🔵 Blue line (ADX) — the overall trend strength reading; rising values indicate strengthening trend, falling values indicate weakening trend or ranging conditions
- 🟢 Green dotted line (+DI) — the positive directional indicator; when above -DI, bullish directional pressure is dominant
- 🔴 Red dotted line (-DI) — the negative directional indicator; when above +DI, bearish directional pressure is dominant
The sub-window header displays the active configuration in real time (e.g. MTF ADX(14) H1 53.6631 25.5004 4.9638), showing the current ADX, +DI, and -DI values for the reference timeframe at a glance.
When the ADX line is rising and above 25, a strong directional trend is confirmed on the reference timeframe. When the ADX is below 25 and flat or falling, the market on that timeframe is ranging or trendless — providing critical context for entries made on the lower timeframe chart.

 Martingale Scanner
1 × USD599.00
Martingale Scanner
1 × USD599.00  CCY Power Indicator
1 × USD199.00
CCY Power Indicator
1 × USD199.00  MTF Moving Average
1 × USD19.90
MTF Moving Average
1 × USD19.90  Script Change All Timeframe
1 × USD0.00
Script Change All Timeframe
1 × USD0.00  MTF ATR
1 × USD19.90
MTF ATR
1 × USD19.90 




Reviews
There are no reviews yet