The MACD is one of the most widely used indicators in trading — and one of the most widely misused. Most traders apply the default 12/26/9 setting on every chart, every pair, every timeframe, without ever questioning whether those numbers are actually optimal for what they're trading right now.
MACD Optimizer answers that question automatically.
It tests every Fast EMA, Slow EMA, and Signal MA combination within your defined range — all three parameters at once — and prints every result directly on your chart. You see the trades. You see the pips. You see the drawdowns. And at the end of the run, you see the exact parameter set that performed best on your instrument, your timeframe, and your selected history window.
✦ All three MACD parameters optimized simultaneously — Fast EMA, Slow EMA, and Signal MA tested together in a single automated run
✦ No Strategy Tester needed — the full optimization runs live, directly on the chart
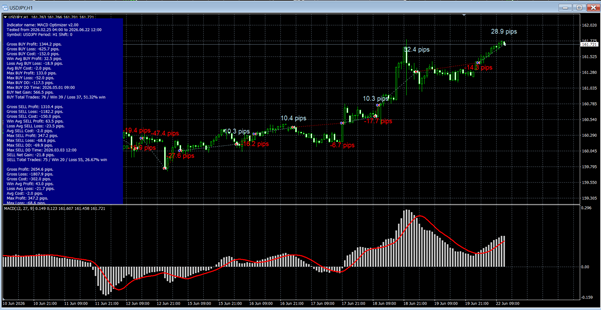
✦ Every trade printed on the chart — green for wins, red for losses, pip values labeled on each candle
✦ Live MACD sub-window — the best parameter set is rendered as a live MACD histogram as the optimizer runs
✦ Five signal modes — optimize for Buy Only, Sell Only, Overall, Buy & Sell, or Buy or Sell to match your exact approach
✦ Buy and Sell tracked separately — understand your directional edge with precision
✦ Date range or rolling window — focus the optimization on any period that matters to your strategy
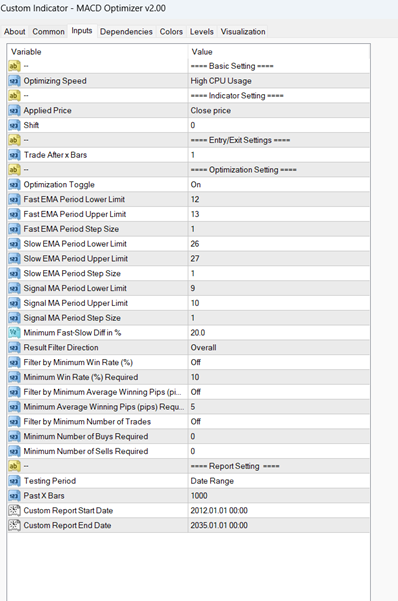
✦ Quality filters built in — set minimum win rate and minimum average pips to ensure only genuinely strong setups pass
Stop using 12/26/9 because it's the default. Start using the setting that actually works — on your chart, right now.
"Stop using the default. Find the setting that actually works."
How It Works
The indicator runs an automated optimization loop across user-defined ranges for all three MACD components simultaneously. A live MACD sub-window is rendered below the main chart showing the histogram and signal line for the currently active best parameter set.
For each combination tested, the indicator:
- Plots simulated entry and exit points directly on the price chart with labeled pip results — green for winning trades, red for losing trades
- Marks drawdown events (DD) at their exact price location with pip values
- Displays a comprehensive on-chart statistics panel with separate Buy, Sell, and Total columns covering gross profit/loss, win average profit, loss average, avg cost, max profit/loss, max drawdown, net gain, total trades, and win rate
- Shows the optimized progress bar completing as each parameter combination is tested
- Outputs the best parameter set at the bottom — including the optimal Fast EMA, Slow EMA, and Signal MA periods — ready to apply immediately
The optimizer can be configured to wait a specified number of bars after a MACD crossover before entering a trade, allowing for crossover confirmation rather than immediate entry.

 MTF ADX
1 × USD19.90
MTF ADX
1 × USD19.90  CCY Power Indicator
1 × USD199.00
CCY Power Indicator
1 × USD199.00 


Reviews
There are no reviews yet