Most traders spend hours in the Strategy Tester trying different MA combinations — running test after test, switching periods, comparing results across separate windows, and still not knowing which setting actually performs best on today's chart, on today's instrument, at this moment in time.
Cross MA Optimizer eliminates all of that in one step.
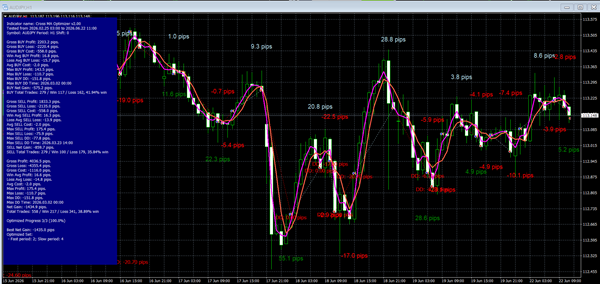
It runs the optimization for you, directly on your live chart, and prints every answer where you can see it — the trades, the pips, the drawdowns, the win rate, and the best parameter set, all labeled right on the price action. You don't need to interpret a spreadsheet. You don't need to run a separate backtest. You don't need to switch windows. The chart tells you everything.
✦ No Strategy Tester needed — optimization runs live, directly on the chart
✦ Every trade result is printed — green for wins, red for losses, pips labeled on each candle
✦ Best parameters found automatically — the winner is printed at the bottom, ready to use
✦ Buy and Sell tracked separately — know if your edge is in longs, shorts, or both
✦ Fully filter-controlled — set minimum win rate, pip thresholds, and trade count to ensure quality results only
Stop guessing which periods work. Stop running endless tests in a separate window. Drop Cross MA Optimizer on your chart — and the answer is already there.
"Stop guessing your MA settings. Let the chart find them for you."
How It Works
The indicator runs an automated optimization loop across user-defined fast and slow MA period ranges, testing every valid combination against your selected history window. For each combination tested, it:
- Plots the fast MA (magenta) and slow MA (red/orange) crossover lines directly on the chart
- Labels every simulated trade entry and exit with its pip result — green for winning trades, red for losing trades
- Marks drawdown events (DD) at their exact price location with the pip value of the drawdown
- Displays a comprehensive on-chart statistics panel covering Buy, Sell, and Overall performance — including gross profit/loss, win rate, average profit/loss per trade, max drawdown, max DD time, and net gain in pips
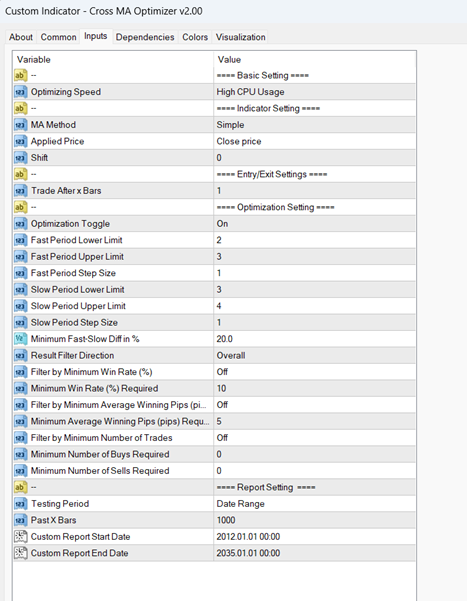
- Outputs the best optimized parameter set at the bottom of the panel (e.g. Fast period: 2; Slow period: 4)
The optimization engine cycles through all period combinations within the defined range and identifies the configuration with the best net gain, with optional filters for minimum win rate, minimum average winning pips, or minimum number of trades.

 Volatility Table
1 × USD69.90
Volatility Table
1 × USD69.90  Forex Correlation Smart Indicator
1 × USD69.90
Forex Correlation Smart Indicator
1 × USD69.90  Band Signal
1 × USD199.00
Band Signal
1 × USD199.00  Visualize On Chart
1 × USD0.00
Visualize On Chart
1 × USD0.00  MTF ATR
1 × USD19.90
MTF ATR
1 × USD19.90 




Reviews
There are no reviews yet