
10
USD6,431.80
10 items
 BT Matrix
  Bingo
Bingo  Dragon Wave
  ADX Printer
  MTF ADX
  MTF Bands
  SMA
SMA  MTF Price ATR
  BED BT
 Member Login

USD199.00
Current Version:
Published:
21 May 2025
Updated:
21 May 2025
Number of Purchases:
3667
Library Version:
1.0


The MetaTrader Strategy Tester tells you the final result. BED BT shows you the journey.
Running a visual backtest without BED BT means watching candles form and trades open and close — but having no real-time view of what is happening to your account equity underneath. The balance steps. The floating loss builds. The drawdown peaks. And you only find out how bad it got when the test ends and you read the summary report.
BED BT puts the equity curve live in your sub-window while the backtest is running.
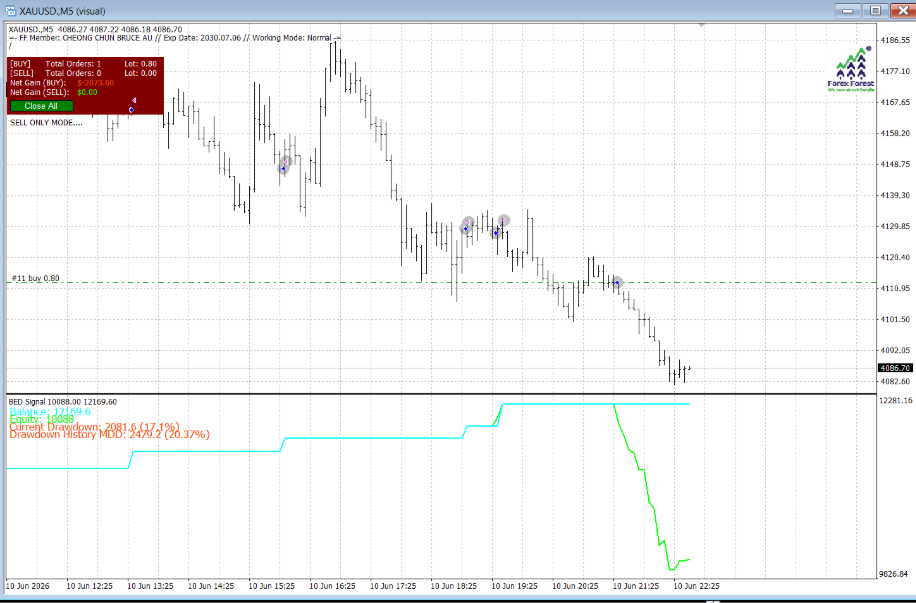
The balance line and equity line are both plotted in real time. The moment your EA's open positions go underwater, the green equity line separates from the cyan balance line — and the gap is immediately visible. Current drawdown in dollars and percentage updates every tick. The Maximum Drawdown History records the worst trough seen at any point. You watch the risk unfold in real time, not after the fact.
As demonstrated on the XAUUSD M5 backtest, the balance curve stepped up cleanly through two profitable phases — then held flat as the EA accumulated buy exposure into a falling gold market. The equity line broke sharply lower, the current drawdown reached 17.1%, and the MDD peaked at 20.37% — all visible live, bar by bar, while the test was still running. That's the information you need to decide whether the strategy's drawdown profile is acceptable before ever trading it live.
✦ Live Balance vs. Equity curves — the gap between them is your open drawdown, visible in real time
✦ Current Drawdown in dollars and % — updates tick by tick as open trades move
✦ Maximum Drawdown History — worst equity trough recorded at any point during the test, always logged
✦ On-chart order dashboard — order count, lot size, and net gain per direction in the main chart window
✦ Visual mode native — renders live during the bar-by-bar visual replay, not only at test end
✦ Zero configuration — attach and run; all data is read automatically from the live backtest account
✦ Any EA, any instrument — works with all Expert Advisors on all symbols and timeframes
Stop reading drawdown statistics in a report after the backtest finishes. Watch them happen in real time while you still have the ability to observe, pause, and understand exactly what your EA is doing to the account at every moment.
"See the drawdown happen. Not just the damage it left."
How It Works
When attached to a visual backtest, BED BT plots two live curves and a real-time statistics panel in a dedicated sub-window below the main price chart:
The on-chart trade panel in the main price window also shows a live order dashboard displaying current BUY and SELL order counts, lot sizes, Net Gain for each direction, and a Close All button — giving you full real-time position visibility alongside the equity curve without switching windows.
Only logged in customers who have purchased this product may leave a review.

Number of Purchased : 309
Add to cart
Number of Purchased : 637
Add to cart
Number of Purchased : 304
Add to cart
Reviews
There are no reviews yet