Setting static point limits for stops and targets doesn't account for changing market conditions. When the market slows down, your targets are too far; when volatility spikes, your stop losses are too tight. Checking different timeframes to measure the true macro daily range is slow and clunky.
MTF Price-ATR v1.00 maps the actual structural volatility of the market right where you trade.
You no longer need to switch tabs or run mental math to figure out the market's true daily movement capacity. This indicator tracks macro range expansion and contraction automatically, displaying it as a clean, step-like line right underneath your execution candles. You see exactly how much room an asset has left to move based on higher timeframe reality.
✦ Macro Volatility Maps — Monitor daily or weekly volatility cycles while timing your trades on an M15 chart.
✦ Precision Target Adjustments — Dynamically adjust your profit targets and stops based on higher-timeframe truth, not guesswork.
✦ Spot Structural Breakouts — Instantly identify when macro consolidation lines begin expanding into strong momentum waves.
✦ Clean Step-Line Design — Keeps the data organized in a dedicated sub-window so your primary chart remains clutter-free.
✦ Universal Terminal Functionality — Works perfectly across Forex pairs, gold, crypto, equity indices, or commodities.
"Stop guessing the market's range. Bring higher-timeframe structural volatility directly to your execution chart."
How It Works
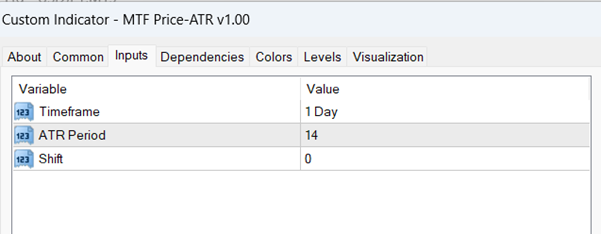
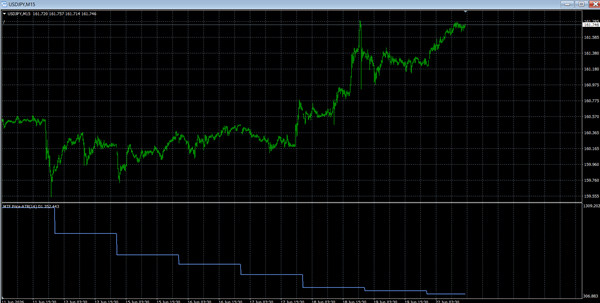
The indicator reads price data from a user-defined reference timeframe (such as 1 Day, as shown in image_749959.png) and calculates the standard ATR value based on that period. It then projects this macro volatility metric seamlessly into a sub-window below your active trading chart (e.g., 15 Minutes), as illustrated in image_749c5f.png.
Because higher timeframe bars cover a substantial number of lower timeframe intervals, the indicator renders the data in a crisp, step-like visual line. This design allows you to track macro structural expansion and compression cleanly:
- Step-Line Visual Progression: Updates dynamically at the completion of each reference timeframe bar, ensuring you are always looking at the true, locked volatility value of the broader trend.
- Volatility Extremes: Easily pinpoint when higher-timeframe market cycles are moving from tight consolidation ranges into explosive breakout environments.

 CCY Power Trend 36 Adv
1 × USD599.00
CCY Power Trend 36 Adv
1 × USD599.00  ZigZag Helper
1 × USD199.00
ZigZag Helper
1 × USD199.00 




Reviews
There are no reviews yet