Overlay Indicator
Multi-Market Perspective with Structural Clarity
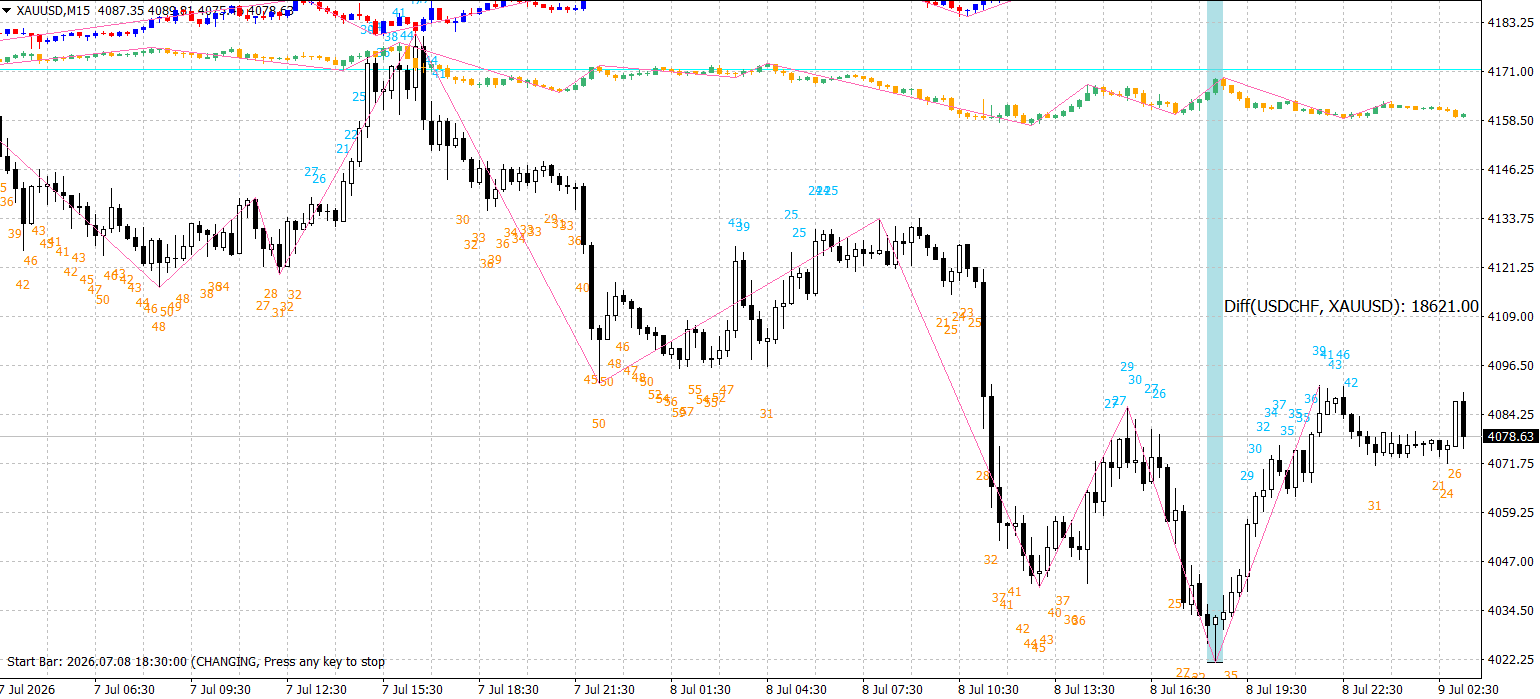
The Overlay Indicator is designed to give traders a broader market perspective by overlaying multiple currency pairs onto a single chart. By combining price action, zigzag structure, and relative movement, it helps traders identify correlations, divergence, and key turning points more effectively.
Key Features
- Multi-Symbol Overlay Analysis
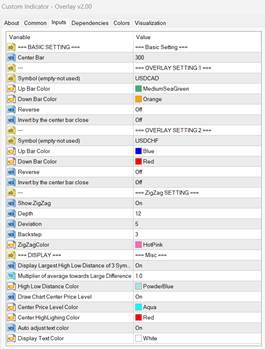
- Overlay multiple instruments (e.g., USDCAD, USDCHF) directly onto your current chart to compare price movement and market behaviour in one unified view.
- ZigZag Market Structure Mapping
- Built-in ZigZag functionality highlights swing highs and lows, making it easier to visualise market structure and identify trend shifts.
- Cross-Market Correlation Insight
- Observe how different instruments move relative to each other—helping you detect confirmation, divergence, or early reversal signals.
- Customisable Visual Settings
- Fully adjustable colors, symbols, and display settings allow you to tailor the overlay for clarity and your specific trading style.
- Live High-Low Distance Tracking
- Displays key metrics such as largest price distance and movement differences, giving additional context on volatility and expansion.
- Center Price Reference
- Option to plot a central price level, helping traders understand how far price has deviated from its mean or equilibrium.
How It Works
The Overlay Indicator maps selected instruments onto a shared chart by aligning price movement around a common reference point (center bar).
- This allows you to compare relative strength, direction, and structure across multiple markets.
- The ZigZag component simplifies price action into clear swing points, making trends and reversals easier to interpret.
- Additional metrics such as high-low distance further highlight expansion phases and potential imbalance in the market.
Why It Matters
Markets are interconnected. Single-chart analysis often limits visibility, while the Overlay Indicator helps traders see how different instruments behave together.
By combining:
- Structure (ZigZag)
- Correlation (multi-symbol overlay)
- Context (distance & center levels)
…it provides a more complete framework for decision-making.
Best For
Traders who want to:
- Analyse multiple currency pairs in one view
- Identify correlation and divergence opportunities
- Improve market structure reading using ZigZag
- Add context to price action beyond a single chart

 CCY Power Trend 9 Pro
1 × USD599.00
CCY Power Trend 9 Pro
1 × USD599.00 



Reviews
There are no reviews yet