Marketing Description
Flipping through multiple charts to check your cycles is slow, distracting, and often causes you to miss the exact moment a trade triggers. By the time you switch to check the hourly chart and come back to execute on your 15-minute chart, the momentum has shifted and the edge is gone.
MTF RSI v1.00 brings the big picture directly to your execution screen.
Instead of guessing what the higher-timeframe momentum looks like, this indicator maps it out right below your current price action. You get a crystal-clear, step-by-step look at higher timeframe momentum, keeping you on the right side of the macro trend without ever losing sight of your lower-timeframe entries.
✦ Macro Momentum on Micro Charts — Monitor hourly or daily RSI cycles while trading on a 15-minute chart.
✦ No More Tab Flipping — See overbought and oversold conditions across multiple dimensions on a single screen.
✦ Perfect Entry Confluence — Wait for lower-timeframe setups to align with higher-timeframe extremes for high-probability wins.
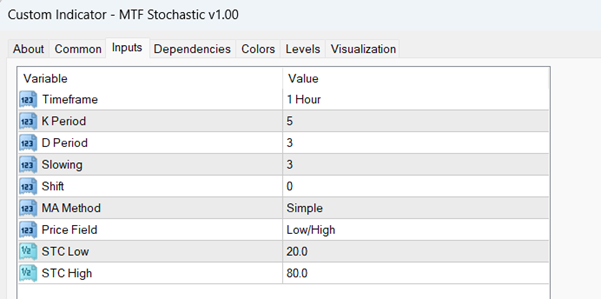
✦ Fully Adaptable Settings — Tailor the periods, price sources, and extreme levels to match your exact trading style.
✦ Universal Instrument Compatibility — Works flawlessly on Forex, Gold, Crypto, Indices, and Commodities.
"Stop guessing the trend. Bring the higher timeframe momentum directly to your execution chart."
How It Works
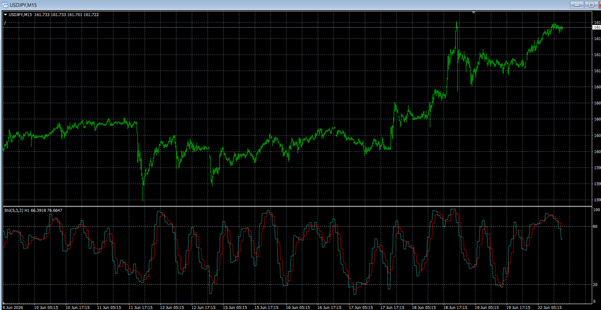
The indicator calculates the standard Relative Strength Index (RSI) using data from a user-specified reference timeframe (e.g., 1 Hour) and plots it seamlessly in a sub-window beneath your current chart (e.g., 15 Minutes).
Because a higher timeframe bar covers multiple lower timeframe bars, the indicator creates a clean, step-like visual progression that reflects the true, developing momentum of the broader market trend.
- Overbought Zone (Default > 70.0): Highlights when the higher timeframe asset is potentially overextended to the upside.
- Oversold Zone (Default < 30.0): Highlights when the higher timeframe asset is potentially overextended to the downside.
- Step-Line Visual: Updates dynamically at the close of each higher timeframe bar, keeping your lower-timeframe execution perfectly anchored to higher-timeframe context.

 Cross Moving Average (MA) Optimizer
1 × USD399.00
Cross Moving Average (MA) Optimizer
1 × USD399.00  MACD Optimizer
1 × USD399.00
MACD Optimizer
1 × USD399.00 





Reviews
There are no reviews yet