Every trader has heard "trade in the direction of the trend." But which trend? The M15 trend changes every hour. The H1 trend lasts days. The D1 trend lasts weeks. If you're trading M15 without seeing the H1 moving average, you're navigating by the noise instead of the signal.
MTF Moving Average puts the higher timeframe MA directly on your price chart.
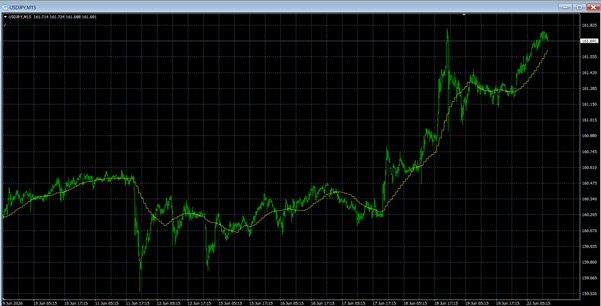
No sub-window. No separate chart. The H1 — or H4, or D1 — moving average is rendered as a single, clean line directly on your candlestick chart, in real time. You see exactly where the higher timeframe trend is, whether price is above or below it, whether the slope is rising or falling, and whether current price is near a meaningful higher timeframe dynamic support or resistance level — all while staying on the M15 chart for execution.
What makes MTF Moving Average particularly powerful is the multi-timeframe stack. When the H1 MA is rising and price is above it, and the H4 MA is also rising with price above it, you have a dual-timeframe trend alignment — one of the most reliable conditions for high-confidence trend continuation entries on the lower timeframe. When the higher timeframe MA is flat or declining while your lower timeframe generates a buy signal, the conflict is immediately visible — protecting you from taking a counter-trend trade into a headwind.
✦ Higher timeframe MA, on your price chart — no sub-window, rendered directly on the candles
✦ Instant trend bias at a glance — price above = bullish bias, price below = bearish bias
✦ Dynamic support and resistance — the higher TF MA is the most meaningful moving price level on the chart
✦ MA slope tells the momentum story — rising slope confirms trend strength, flat slope warns of transition
✦ Any MA method — SMA, EMA, SMMA, or LWMA — your choice
✦ Any timeframe combination — H1 MA on M15, D1 MA on H4, or any pairing you need
✦ Cross-timeframe trend alignment — dual-TF MA agreement is one of the strongest trend confirmation signals available
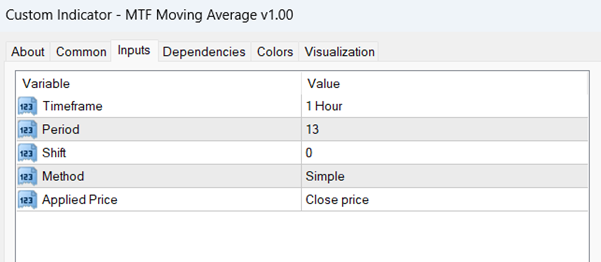
✦ Five inputs, instant setup — timeframe, period, shift, method, applied price — nothing else required
Whether you trade trend continuation, pullbacks to the MA, or breakouts above/below the MA — MTF Moving Average ensures the higher timeframe trend is always in front of you, on the chart you're actually trading.
"One line. One answer. Is the higher timeframe trend with you or against you?"
How It Works
The indicator calculates a moving average on the selected reference timeframe (default: 1 Hour) using a configurable period, method, shift, and applied price, then plots it as a single smooth yellow/gold line directly on the main price panel.
Key readings the MA provides:
- Price above the reference timeframe MA — higher timeframe trend is bullish; favor long entries, avoid shorts
- Price below the reference timeframe MA — higher timeframe trend is bearish; favor short entries, avoid longs
- Price crossing the reference timeframe MA — potential higher timeframe trend change; heightened attention warranted
- MA slope rising — higher timeframe momentum is accelerating upward; trend is strengthening
MA slope flattening — higher timeframe momentum is decelerating; trend may be losing strength or transitioning to range

 Cross Power Optimiser
1 × USD199.00
Cross Power Optimiser
1 × USD199.00 




Reviews
There are no reviews yet