MACD on your execution chart tells you the momentum state of your execution timeframe. That's useful — but it's not the story that matters. The momentum environment that determines whether your trade has a genuine tailwind or is fighting an invisible headwind — that's on the higher timeframe. And most traders never look at it while they're trying to time an entry on M15.
MTF MACD puts the higher timeframe MACD directly in your sub-window.
Set your reference timeframe, attach the indicator, and the H1 — or H4, or D1 — histogram, MACD line, and signal line appear instantly below your price chart. The live values are printed in the header. You know in real time whether the momentum on the timeframe that matters is building, peaking, decelerating, or already reversing — before you click Buy or Sell on the lower timeframe.
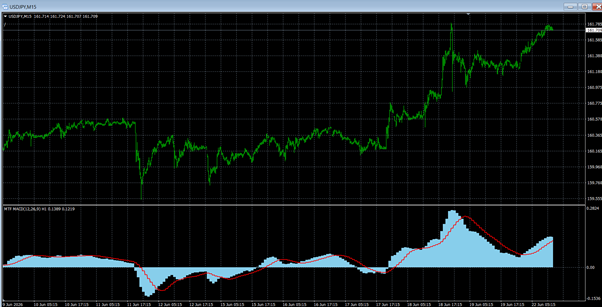
As the USDJPY M15 chart demonstrates, the H1 MACD sub-window told the full story: neutral, directionless histogram from June 10–17, followed by an explosive positive histogram expansion from June 17 onward — perfectly aligned with the sharp rally on the main chart. A trader watching the H1 MACD in real time had advance warning that macro momentum was accelerating, providing high-confidence context for every long entry taken on the M15 during that rally phase.
What makes MTF MACD particularly powerful is the multi-timeframe dimension. When the H1 MACD is bullish and expanding at the same time the H4 MACD is also above zero and rising, you have dual-timeframe momentum confirmation — a far stronger foundation for a directional trade than the lower timeframe signal alone. When the higher timeframe MACD is near zero or declining while the lower timeframe generates a buy signal, you have a conflict — and MTF MACD makes that conflict immediately visible before you enter.
✦ Higher timeframe MACD, always visible — no chart switching, no second window, no guessing
✦ Full MACD structure displayed — histogram, MACD line, and signal line all in one sub-window
✦ Live values in the header — current MACD and signal readings update with every tick
✦ Macro momentum context for every trade — know whether the higher timeframe is with you or against you
✦ Cross-timeframe momentum confirmation — dual-timeframe MACD alignment is a significantly stronger signal
✦ Divergence detection across timeframes — higher TF MACD divergence with price is one of the most reliable reversal signals in technical analysis
✦ Any timeframe combination — H1 MACD on M15, D1 MACD on H4, or any pairing you need
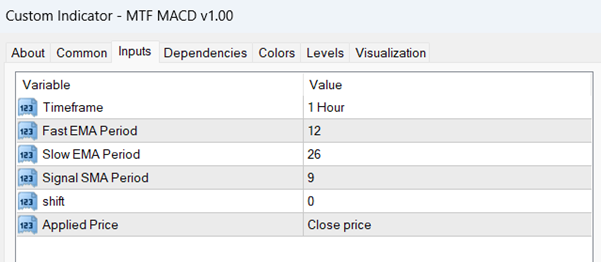
✦ Five inputs, instant setup — timeframe, fast, slow, signal, shift — nothing else required
Whether you trade momentum breakouts, trend continuation, or divergence reversals — MTF MACD ensures the higher timeframe momentum picture is always in front of you, on the chart you're actually trading.
"Know the momentum that matters — before you click Buy or Sell."
How It Works
The indicator calculates the full MACD on the selected reference timeframe (default: 1 Hour) using configurable Fast EMA, Slow EMA, Signal SMA, Shift, and Applied Price settings, then renders all three components in a dedicated sub-window below the main price chart:
- 🔵 Cyan/blue histogram bars — the MACD histogram showing the difference between the MACD line and signal line; expanding bars above zero indicate accelerating bullish momentum, expanding bars below zero indicate accelerating bearish momentum
- 🔴 Red signal line — the smoothed signal MA overlaid on the histogram; crossovers between the MACD line and signal line on the reference timeframe generate directional bias signals
- ⬛ Dark histogram bars — histogram bars where the MACD is converging back toward the signal line, indicating momentum is slowing within the current trend direction
The sub-window header displays the active configuration and current values in real time (e.g. MTF MACD(12,26,9) H1 0.1395 0.1219), showing the live MACD and signal values from the reference timeframe at a glance.

 Cross Power Optimiser
1 × USD199.00
Cross Power Optimiser
1 × USD199.00  ZigZag Helper
1 × USD199.00
ZigZag Helper
1 × USD199.00 





Reviews
There are no reviews yet