Bollinger Bands on your execution chart tell you what the bands look like on your execution timeframe. That's useful — but it's not the full picture. The bands that define the real dynamic range, the real support and resistance, the real volatility environment your trade is operating in — those are on the higher timeframe. And most traders never look at them while they're managing a live position.
MTF Bands puts the higher timeframe Bollinger Bands directly on your price chart.
No sub-window. No separate chart. The H1 — or H4, or D1 — upper, middle, and lower bands are rendered directly on your candlestick chart in real time. You see exactly where the higher timeframe bands are sitting relative to current price, whether they're expanding or contracting, and whether price is extended toward either extreme or comfortably centered within the range.
What makes MTF Bands particularly powerful is the multi-timeframe dimension. When price on your M15 chart is approaching the H1 upper band at the same time the H4 band is also showing price near its upper extreme, you have a dual-timeframe resistance confluence — a much stronger reason to expect a pullback or rejection than either signal alone. When both timeframes show band expansion simultaneously, you have cross-timeframe confirmation that a genuine trend move is underway, not just lower timeframe noise.
✦ Higher timeframe Bands on your price chart — no sub-window, rendered directly on the candles
✦ Upper, middle, and lower bands all displayed — full structure visible at all times
✦ Band expansion and contraction always visible — see the higher timeframe volatility state at a glance
✦ Dynamic support and resistance — higher timeframe band levels are the most meaningful price reference on the chart
✦ Any timeframe combination — H1 Bands on M15, D1 Bands on H4, or any pairing you need
✦ Cross-timeframe confluence — signals confirmed on multiple timeframes carry significantly more weight
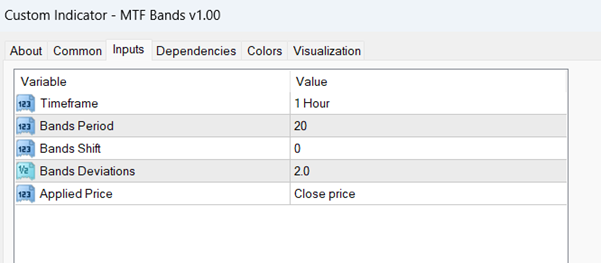
✦ Five inputs, instant setup — timeframe, period, shift, deviations, applied price — nothing else required
Whether you're trading breakouts, mean reversions, or trend continuation — MTF Bands gives you the higher timeframe dynamic range structure that defines the market environment your trade is actually operating within.
"Trade inside the structure that actually matters — the higher timeframe bands."
How It Works
The indicator calculates Bollinger Bands on the selected reference timeframe (default: 1 Hour) using a configurable period, deviation, shift, and applied price, then plots all three bands as continuous cyan/aqua lines directly on the main price panel.
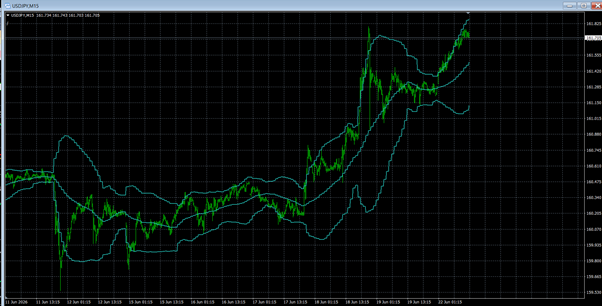
As seen on the USDJPY M15 chart with H1 Bands displayed, all three bands — upper, middle, and lower — are rendered as smooth, structured cyan lines that move significantly more slowly and clearly than the M15 price action beneath them. During the June 11–17 consolidation phase, the bands contracted and moved sideways, visually confirming the H1 was in a low-volatility range. From June 17 onward, the bands began expanding and tilting sharply upward, with the upper band extending well above 161.50 — precisely capturing the explosive USDJPY rally on the H1 timeframe while the trader remained on the M15 chart for execution detail.
Key readings the bands provide:
- Price touching or breaching the upper band on the reference timeframe signals overbought extension or strong bullish momentum on that higher timeframe
- Price touching or breaching the lower band signals oversold extension or strong bearish momentum
- Band width expansion indicates volatility is increasing on the reference timeframe — confirming a trending environment is active
Band width contraction (squeeze) indicates volatility compression on the higher timeframe — signaling a potential breakout is building

 BED Monitor
1 × USD69.90
BED Monitor
1 × USD69.90 




Reviews
There are no reviews yet