Most traders watch one chart at a time. But every trade you take in Forex is not just a position on one pair — it's an implicit position on the currencies that make it up. If you're long AUDUSD and long AUDJPY at the same time, you're not diversified. You're double-long AUD, and you don't even know it.
Forex Correlation Smart Indicator shows you the full picture.
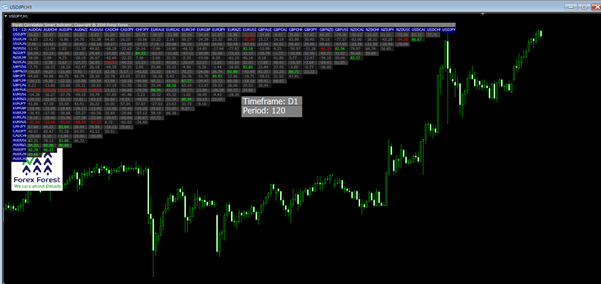
It calculates the correlation between every pair in the market and puts the entire matrix right on your screen — updated live, color-coded, and instantly readable. Green means they move together. Red means they move against each other. One glance at the table and you know exactly which positions reinforce each other, which cancel out, and where your real risk is concentrated.
✦ The entire Forex correlation matrix, live on your chart — every pair-to-pair relationship calculated and displayed simultaneously
✦ Instantly spot over-correlation — see at a glance if your open positions are all moving in the same direction
✦ Green and red highlighting — strong correlations pop out immediately without scanning numbers manually
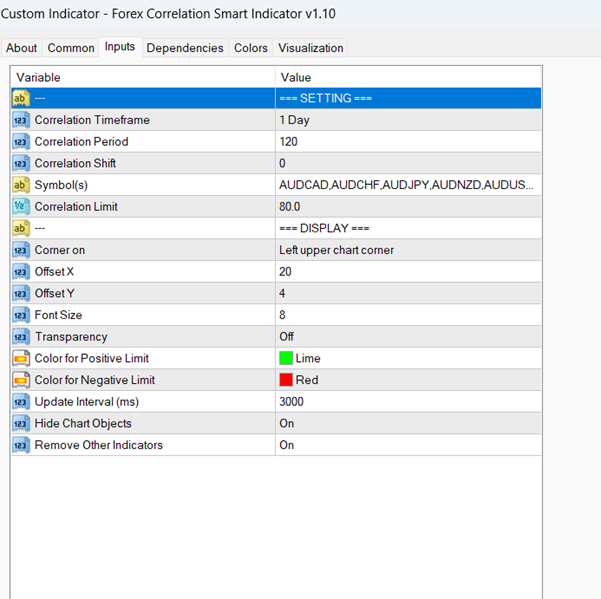
✦ Any timeframe, any lookback — D1 macro correlations or M15 intraday correlations, your choice
✦ Fully customizable symbol list — include exactly the pairs you trade, nothing more
✦ Clean chart mode — hide everything else and focus purely on the correlation data
Whether you're managing risk across a multi-pair portfolio, selecting the best pairs to trade today, or watching for correlation breakdowns that signal major moves — this matrix gives you the market-wide view that a single chart never can.
"One table. Every pair. Total market awareness."
How It Works
The indicator calculates the Pearson correlation coefficient between every pair in the configured symbol list, using a user-defined period and timeframe, and renders the results as a triangular correlation matrix overlaid on the chart:
- 🟩 Green values — positive correlations at or above the Correlation Limit (default: 80.0), indicating pairs that move strongly together
- 🟥 Red values — negative correlations at or below the negative limit (e.g. -80.0), indicating pairs that move strongly in opposite directions
- ⬜ White/neutral values — correlations between the limits, indicating weak or no meaningful relationship
The matrix covers the full universe of configured pairs — including AUDJPY, AUDUSD, AUDCAD, AUDCHF, AUDNZD, USDJPY, USDCAD, USDCHF, EURUSD, EURJPY, EURGBP, EURCHF, GBPUSD, GBPJPY, NZDUSD, NZDJPY, and more — displayed as row and column headers with correlation values at each intersection. A tooltip overlay confirms the active Timeframe: D1 / Period: 120 currently applied.

 Flash Level Scanner
2 × USD199.00
Flash Level Scanner
2 × USD199.00  Visualize On Chart
1 × USD0.00
Visualize On Chart
1 × USD0.00  MTF Stochastic
1 × USD19.90
MTF Stochastic
1 × USD19.90  Stable Helper
1 × USD399.00
Stable Helper
1 × USD399.00  Cross Moving Average (MA) Optimizer
1 × USD399.00
Cross Moving Average (MA) Optimizer
1 × USD399.00  SMA
1 × USD2,699.00
SMA
1 × USD2,699.00  Forex Correlation Smart Indicator
1 × USD69.90
Forex Correlation Smart Indicator
1 × USD69.90  ZigZag Helper
1 × USD199.00
ZigZag Helper
1 × USD199.00  BED Monitor
1 × USD69.90
BED Monitor
1 × USD69.90  Band Signal
1 × USD199.00
Band Signal
1 × USD199.00 



Reviews
There are no reviews yet