Drawing support and resistance levels manually takes time, requires judgment, and varies from trader to trader. Most traders either miss levels entirely or draw too many, cluttering the chart with lines that ultimately don't produce clean entries.
Flash Level Scanner removes the guesswork and does it for you.
It scans the market, finds the levels that have historically mattered, and places BUY STOP and SELL STOP zones directly on your chart — labeled, classified, and ready to act on. You don't draw anything. You don't need to decide what counts as a level. The scanner does it, and the chart shows you the answer.
✦ Levels found automatically — no manual drawing, no subjectivity, no missed zones
✦ BUY STOP and SELL STOP clearly labeled — direction is classified for you at every level
✦ Sensing area visualized — see exactly how much price room each level has around it
✦ Reference any timeframe — scan H1 levels while trading M15, or M30 levels while on H4
✦ Distance filter keeps it clean — only relevant levels near current price are shown
✦ Works on any instrument — FX pairs, gold, indices, any asset in your terminal
Whether you trade breakouts, pending orders, or just need a clean map of where the market has memory — Flash Level Scanner draws it for you in seconds.
"Stop drawing levels. Let the scanner find them."
How It Works
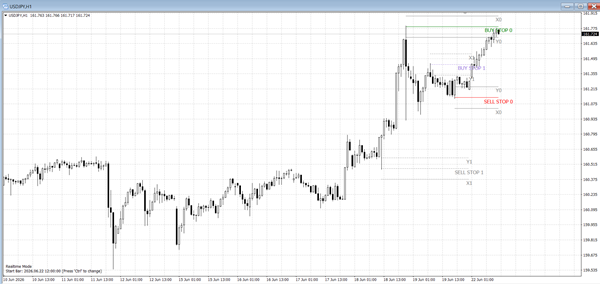
The indicator looks back across a configurable number of bars and levels on a reference timeframe (default: 30 Minutes), scanning for price zones where significant reactions have previously occurred. It then plots these levels on the current chart as horizontal trigger lines with a visible sensing area:
- 🟢 BUY STOP levels (green/blue labels) — price zones above current price where an upside breakout entry would be triggered
- 🔴 SELL STOP levels (red labels) — price zones below current price where a downside breakout entry would be triggered
Each level is plotted with:
- A horizontal entry line at the identified price
- A sensing area (front Y and rear X boundaries in points) that defines the activation zone around the level
- Coordinate labels (X0, X1, Y0, Y1) marking the corners of the sensing zone for precise visual reference
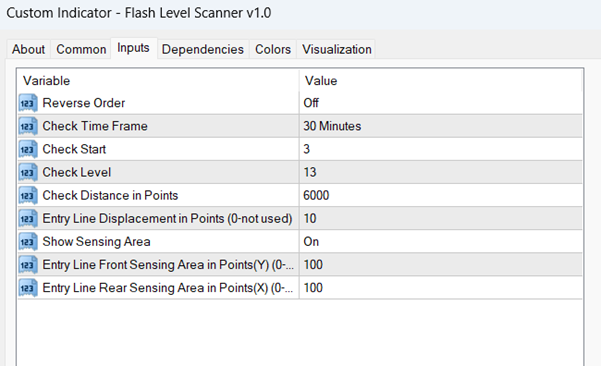
The scanner checks levels starting from a defined bar offset (Check Start: 3) and scans across a user-defined number of levels (Check Level: 13), filtering only those within a maximum distance from current price (Check Distance: 6000 points).

 Martingale Scanner
1 × USD599.00
Martingale Scanner
1 × USD599.00 




Reviews
There are no reviews yet