Most currency strength tools show you a dashboard of colored bars. You look at them, make a judgment call, and hope it's right. There's no backtesting, no optimization, no way to know if the settings you're using actually produce positive results — you just guess and trade.
Cross Power Optimiser removes the guesswork entirely.
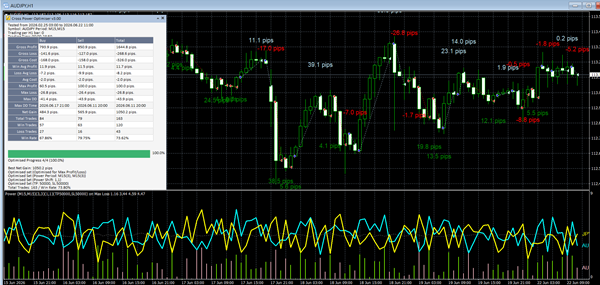
It doesn't just show you currency power — it measures it, optimizes it, and prints every result directly on your chart so you can see exactly how each period combination has performed historically, trade by trade, pip by pip. You get the signals, the statistics, and the best parameter set, all in one place.
✦ Currency power, not price — trades the strength crossover of base vs. quote currency, capturing the true driver of price movement
✦ No Strategy Tester needed — full optimization runs live on the chart in real time
✦ Every trade printed on the chart — green for wins, red for losses, pips labeled on each candle
✦ TP and SL optimized automatically — the best risk/reward parameters found alongside the best periods
✦ Buy and Sell tracked separately — know your directional edge precisely
✦ Session filter built in — trade only when the market is most active for your pair
✦ Dual timeframe engine — set base and quote currency on independent timeframes for maximum flexibility
This is not just an indicator. It's a complete on-chart optimization system built around how currencies actually move — by power, not by price.
"Don't trade the price crossover. Trade the power crossover."
How It Works
The indicator calculates a currency power oscillator for both the base currency (e.g. EUR) and quote currency (e.g. USD) using separate configurable timeframes. A sub-window displays two oscillating power lines:
- 🟡 Yellow line — Base currency power (e.g. EUR, calculated on Timeframe Base)
- 🔵 Cyan line — Quote currency power (e.g. USD, calculated on Timeframe Quote)
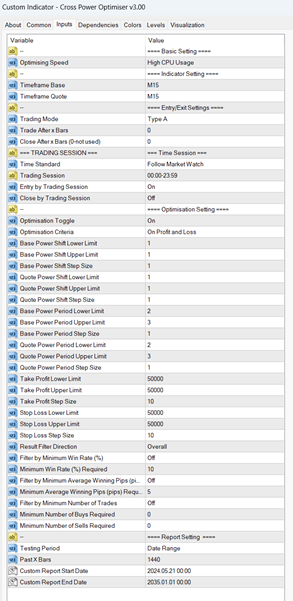
When the base power line crosses above the quote power line, a buy signal is generated. When it crosses below, a sell signal is generated. The indicator then runs a full optimization loop across user-defined period and shift ranges for both currencies, testing every valid combination and identifying the best-performing parameter set.

 Cross Moving Average (MA) Optimizer
1 × USD399.00
Cross Moving Average (MA) Optimizer
1 × USD399.00 





Reviews
There are no reviews yet