Most traders have no idea what their account actually looks like in real time. They check the terminal occasionally, glance at a number, and move on. By the time drawdown is becoming a problem, they've already missed the moment they should have acted.
BED Monitor changes that completely.
It takes your account's full story — balance, equity, drawdown, profit factor, recovery factor — and puts it all on your chart, live, updating with every tick. One glance at the bottom panel tells you exactly where you stand. One look at the curve tells you the trajectory you're on.
✦ No separate reports needed — your account performance is live on the chart at all times
✦ Balance and equity curves in one view — see divergence between the two the moment it starts
✦ Full drawdown metrics displayed — absolute, relative, and max drawdown always visible
✦ Filter by EA magic number — track multiple strategies on the same account independently
✦ Equity alert built in — get notified the moment your equity drops below a level that matters
✦ Works on any account — live, demo, or historical date range of your choice
You don't need a spreadsheet. You don't need to generate a report. You don't need to leave the chart. BED Monitor makes your account as readable as your price action — because in trading, knowing where you stand is just as important as knowing where the market is going.
"Your account, live on your chart. Always."
How It Works
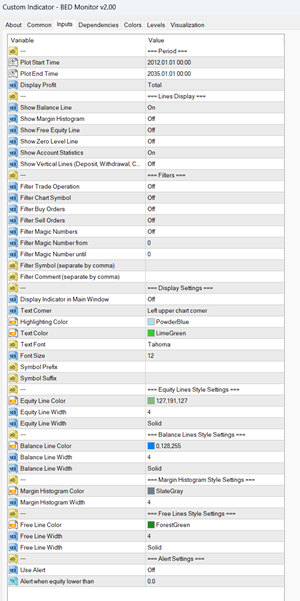
The indicator reads live account data from your MetaTrader terminal and renders it as chart-based lines and statistics across a user-defined date range (default: 2012.01.01 to 2035.01.01). Three core metrics are tracked and displayed:
·🔵 Balance Line — plots your running account balance over time, showing cumulative profit and loss progression
·🟢 Equity Line — plots your real-time equity including open floating positions
·🔲 Margin Histogram — optional bar histogram displaying used margin levels across history
- levels across history
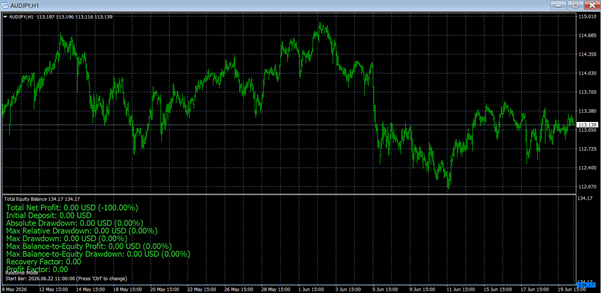
In addition, the indicator overlays a live Account Statistics panel directly on the chart corner, displaying:
- Total Net Profit / Loss (USD and %)
- Initial Deposit
- Absolute, Relative, and Max Drawdown
- Max Balance-to-Equity Profit and Drawdown
- Recovery Factor and Profit Factor

 Forex Correlation Smart Indicator
1 × USD69.90
Forex Correlation Smart Indicator
1 × USD69.90 




Reviews
There are no reviews yet